Yet again, the week has been slow and driven by macro headlines. Cryptocurrencies keep holding up better than TradFi with volatility decreasing, while VIX breached 32, MOVE is above 148 and DXY is at 113. Looking ahead, we will soon have the FOMC minutes and CPI numbers.
On the macro side:
Last week, both unemployment numbers and NFP came in.
NFP were +263k in September, above the expected 250k, but below the previous 315k. The unemployment rate dropped from 3.7% to 3.5%, but the participation rate dropped by 0.1%. As we mentioned in the past, if the labour market holds steady the Fed will keep pursuing the goal “to foster economic conditions that achieve both stable prices and maximum sustainable employment”. In other words: it will keep hiking until something breaks – regardless of whether this is on the demand side or the supply side.
I am not expecting a Fed pivot any time soon, and we are very likely to see another 2x 75bps on both Nov 2nd and Dec 14th meetings, going into 425-450bps target rate by year end.
Financial markets, and especially the FX and FI markets are very stressed, but equities are surprisingly (?) holding up well.
1. ICE BofA CCC & Lower US High Yield Index Option-Adjusted Spread rose to 12.32% from 7.34% on January 2022, yet on March 2020 it was 17.79% and on March 2008 it was 36.7% (source: FRED Economic Data St.Louis Fed)

2. ICE BofA BB US High Yield Index Option-Adjusted Spread is still rather low ~3.21%, but considering the uptrend and the debt structure of BB economies it is a “quiet value” (source: FRED Economic Data St.Louis Fed)

3. VIX is at 32.45 and MOVE at 148.45 with the VVIX at 107.11 (both equities and bonds)
Derivatives players are looking for both downside speculation and hedging. Nevertheless, these indices move quickly and even if it is hard to time them, they report the market fear.

4. US mortgage rates keep rising:
a. 30-year Fixed 6.66% vs 3.098% on Jan 22
b. 15-year Fixed: 5.9% vs 2.43% on Jan22
c. 5/1 ARM: 5.36% vs 2.41 on Jan22
It makes a huge difference to ask for loan to buy a house at 5.9% instead of 2.43%. In dollar terms, a 15-year loan on $500k in January 2022 is equivalent to a loan on 361k today. That’s a 27.8% decrease in purchasing power (excluding inflation)! We might expect these discrepancies to weigh on house prices very soon.

It is hard to say if things are going to get worse or better from here, but I would rather expect that many sectors will suffer more than others. The cascade effect is hard to pre-test. But there is more pain out there.
TradFi Equity indices are approaching pre-Covid levels:
1. SPX: $3,612 vs. $3,385 before covid
2. NDQ: $10,926 vs. $9,718 before Covid
3. DJI: $29,202 vs. $29,537 before Covid
These levels act as a magnet and breaking through them might dictate the next market moves, also in the digital space.
Looking ahead:
This week is once again all about the Fed:
1. Wednesday 8 pm CEST: FOMC Minutes Release
2. Thursday 2.30 pm CEST: CPI Release
Markets are positioned as follows, and I am not expecting any sharp moves, unless numbers are way worse or much better than the expected.
a. US CPI MoM: cons: 0.2%, prev: 0.1%
b. US CPI YoY: cons: 8.1%, prev: 8.3%
c. US Core CPI MoM: cons: 0.5%, prev: 0.6%
d. US Core CPI YoY: cons: 6.5%, prev: 6.3%
On the crypto side:
Most digital assets are holding prices in tight ranges:
- $BTC: $19,051 (-3% WoW) and 30-day Realized Vol: 52.67% (bottom 15% last 360d)
- $ETH: $1,276 (-3.56% WoW) and 30-day Realized Vol: 76.15% (bottom 30% last 360d)
- $SOL: $31.44 (-4.41% WoW) and 30-day Realized Vol: 78.77% (bottom 5% last 360d)
Despite being very volatile assets, volatility in general decreased as liquidity shrunk and May fears seem to have passed (Terra-Luna, 3AC, Celsius, Voyager, etc.)
Also, recently options market makers have been long gamma, and to hold delta-neutral positions they were selling spot (and/or the future) on any uptick and buying spot (and/or the future) on any downtick, thus compressing the volatility and pushing down both the futures basis and the funding rates.
As a reference, these have been the funding rates on FTX:
a. BTC 7d avg: -3.56% vs. 90d avg -2.28%
b. ETH 7d avg: -7.6% vs. 90d avg -11.72%
c. SOL 7d avg: -5.12% vs. 90d avg -7.39%
Currently, BTC gamma exposure is approaching lower levels. While premia between the implied volatility and realized volatility are tiny, as soon as the GEX approaches zero or even negative territory, we may expect a pick-up in volatility.

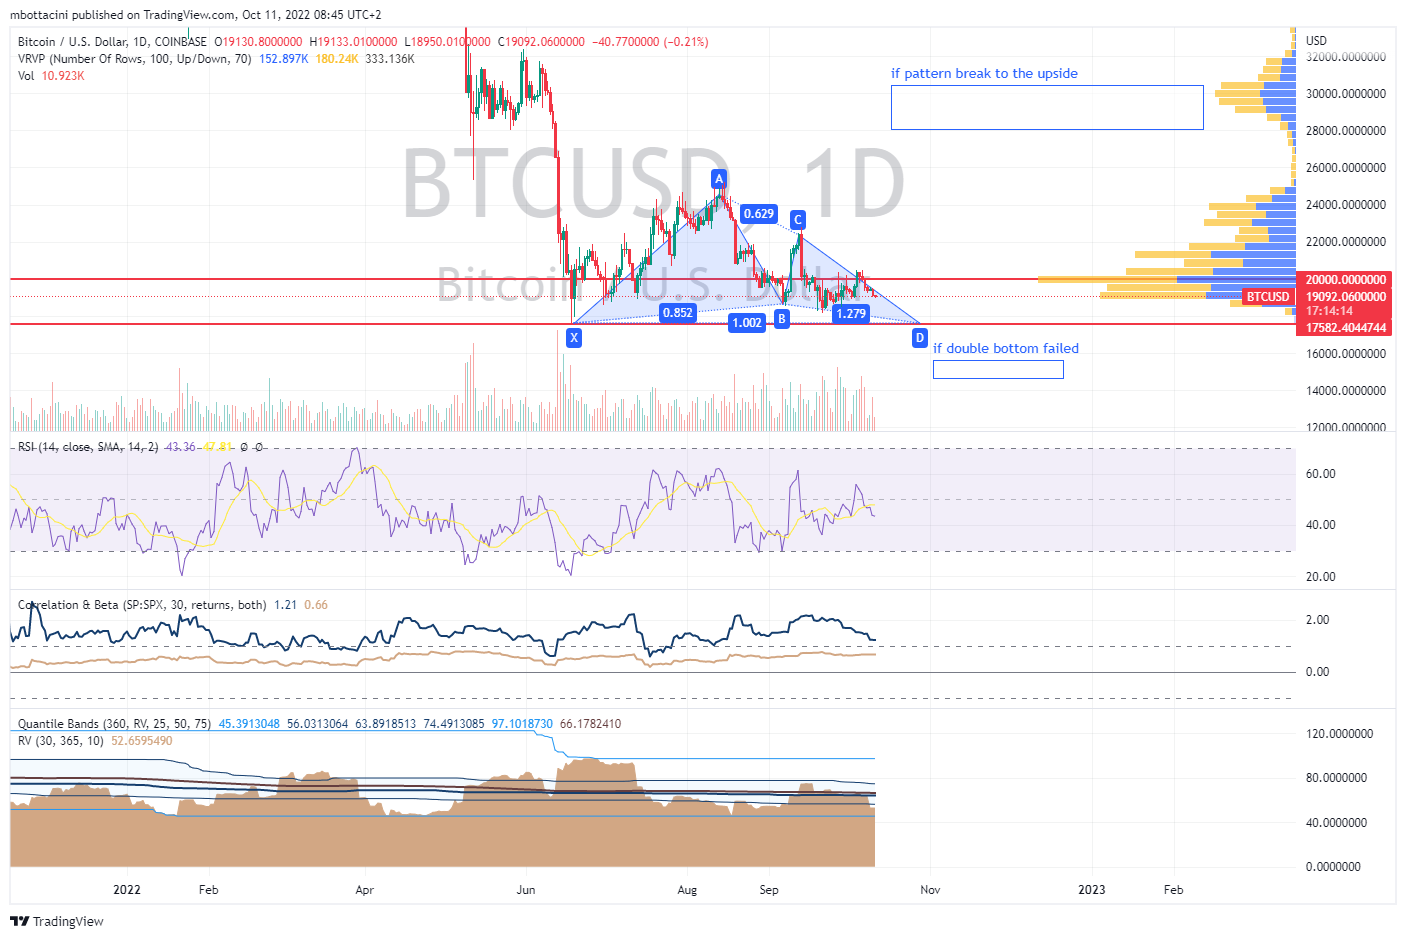
Looking at the spot chart:
BTCUSD is holding the XABCD pattern and if it approaches $17,500 (support), the double bottom would then be tested. RSI is neutral and $20k is once again the resistance.