This week’s macro figures:
Wednesday, August 3:
US ISM (prev. 55.3; exp. 53.5)
Thursday, August 4:
Bank of England rate decision (prev. 1.25%; exp. 1.75%) US initial jobless claims (prev.256k; exp. 259k)
Friday, August 5:
US nonfarm payrolls (prev. 381k, exp. 223k)
This week, the focus is on the labour market data in the US. Last week, the U.S. GDP turned out negative for the second quarter in a row, and this is still not being defined as a technical recession (yet). Also last week, the leading PMIs of various countries were below 50, and therefore in contraction territory. This means that the global macro environment is continuing to weaken.
This week is all about negative divergences in the RSI.
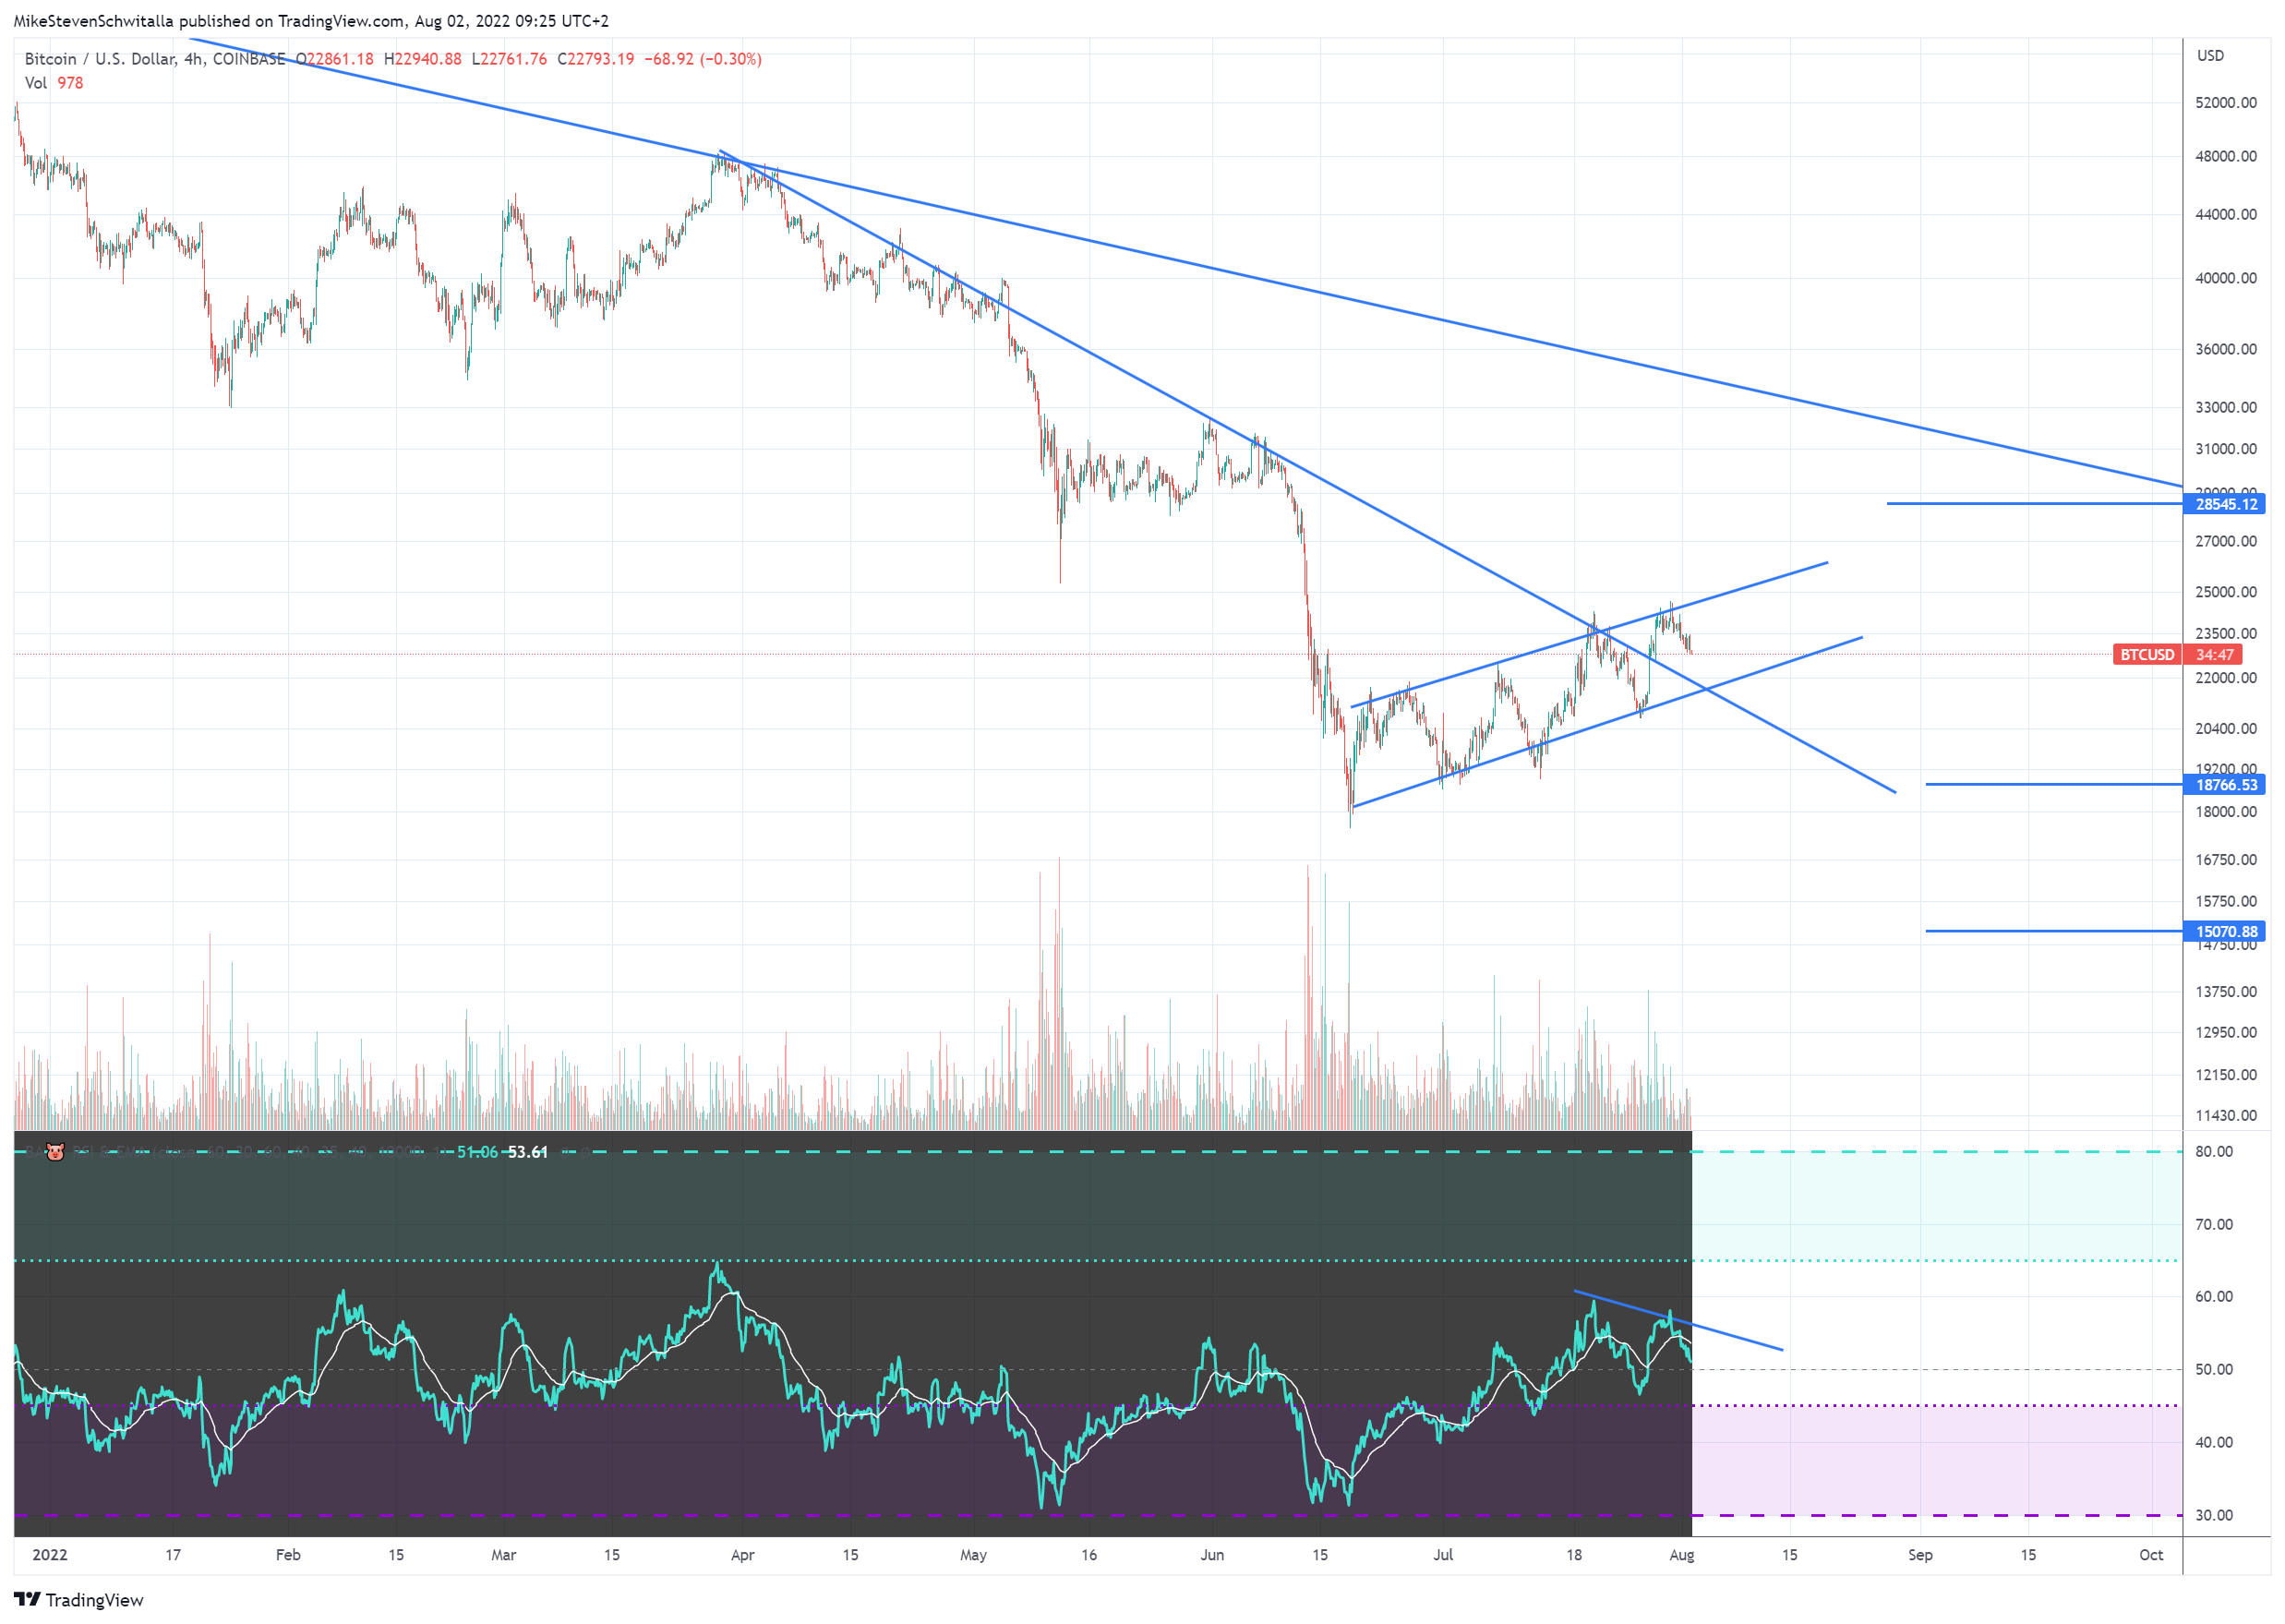
BTC$ 4h
BTC$ managed to break the downtrend to the upside last week. However, the momentum does not look sustainable, and a negative divergence has also formed in the RSI. Therefore, I continue to believe that BTC$ will fall well below USD 20,000, and USD 15,000 is my medium-term price target.
Supports: USD 22,000, 18,750, 15,000
Resistances: USD 28,500, downtrend
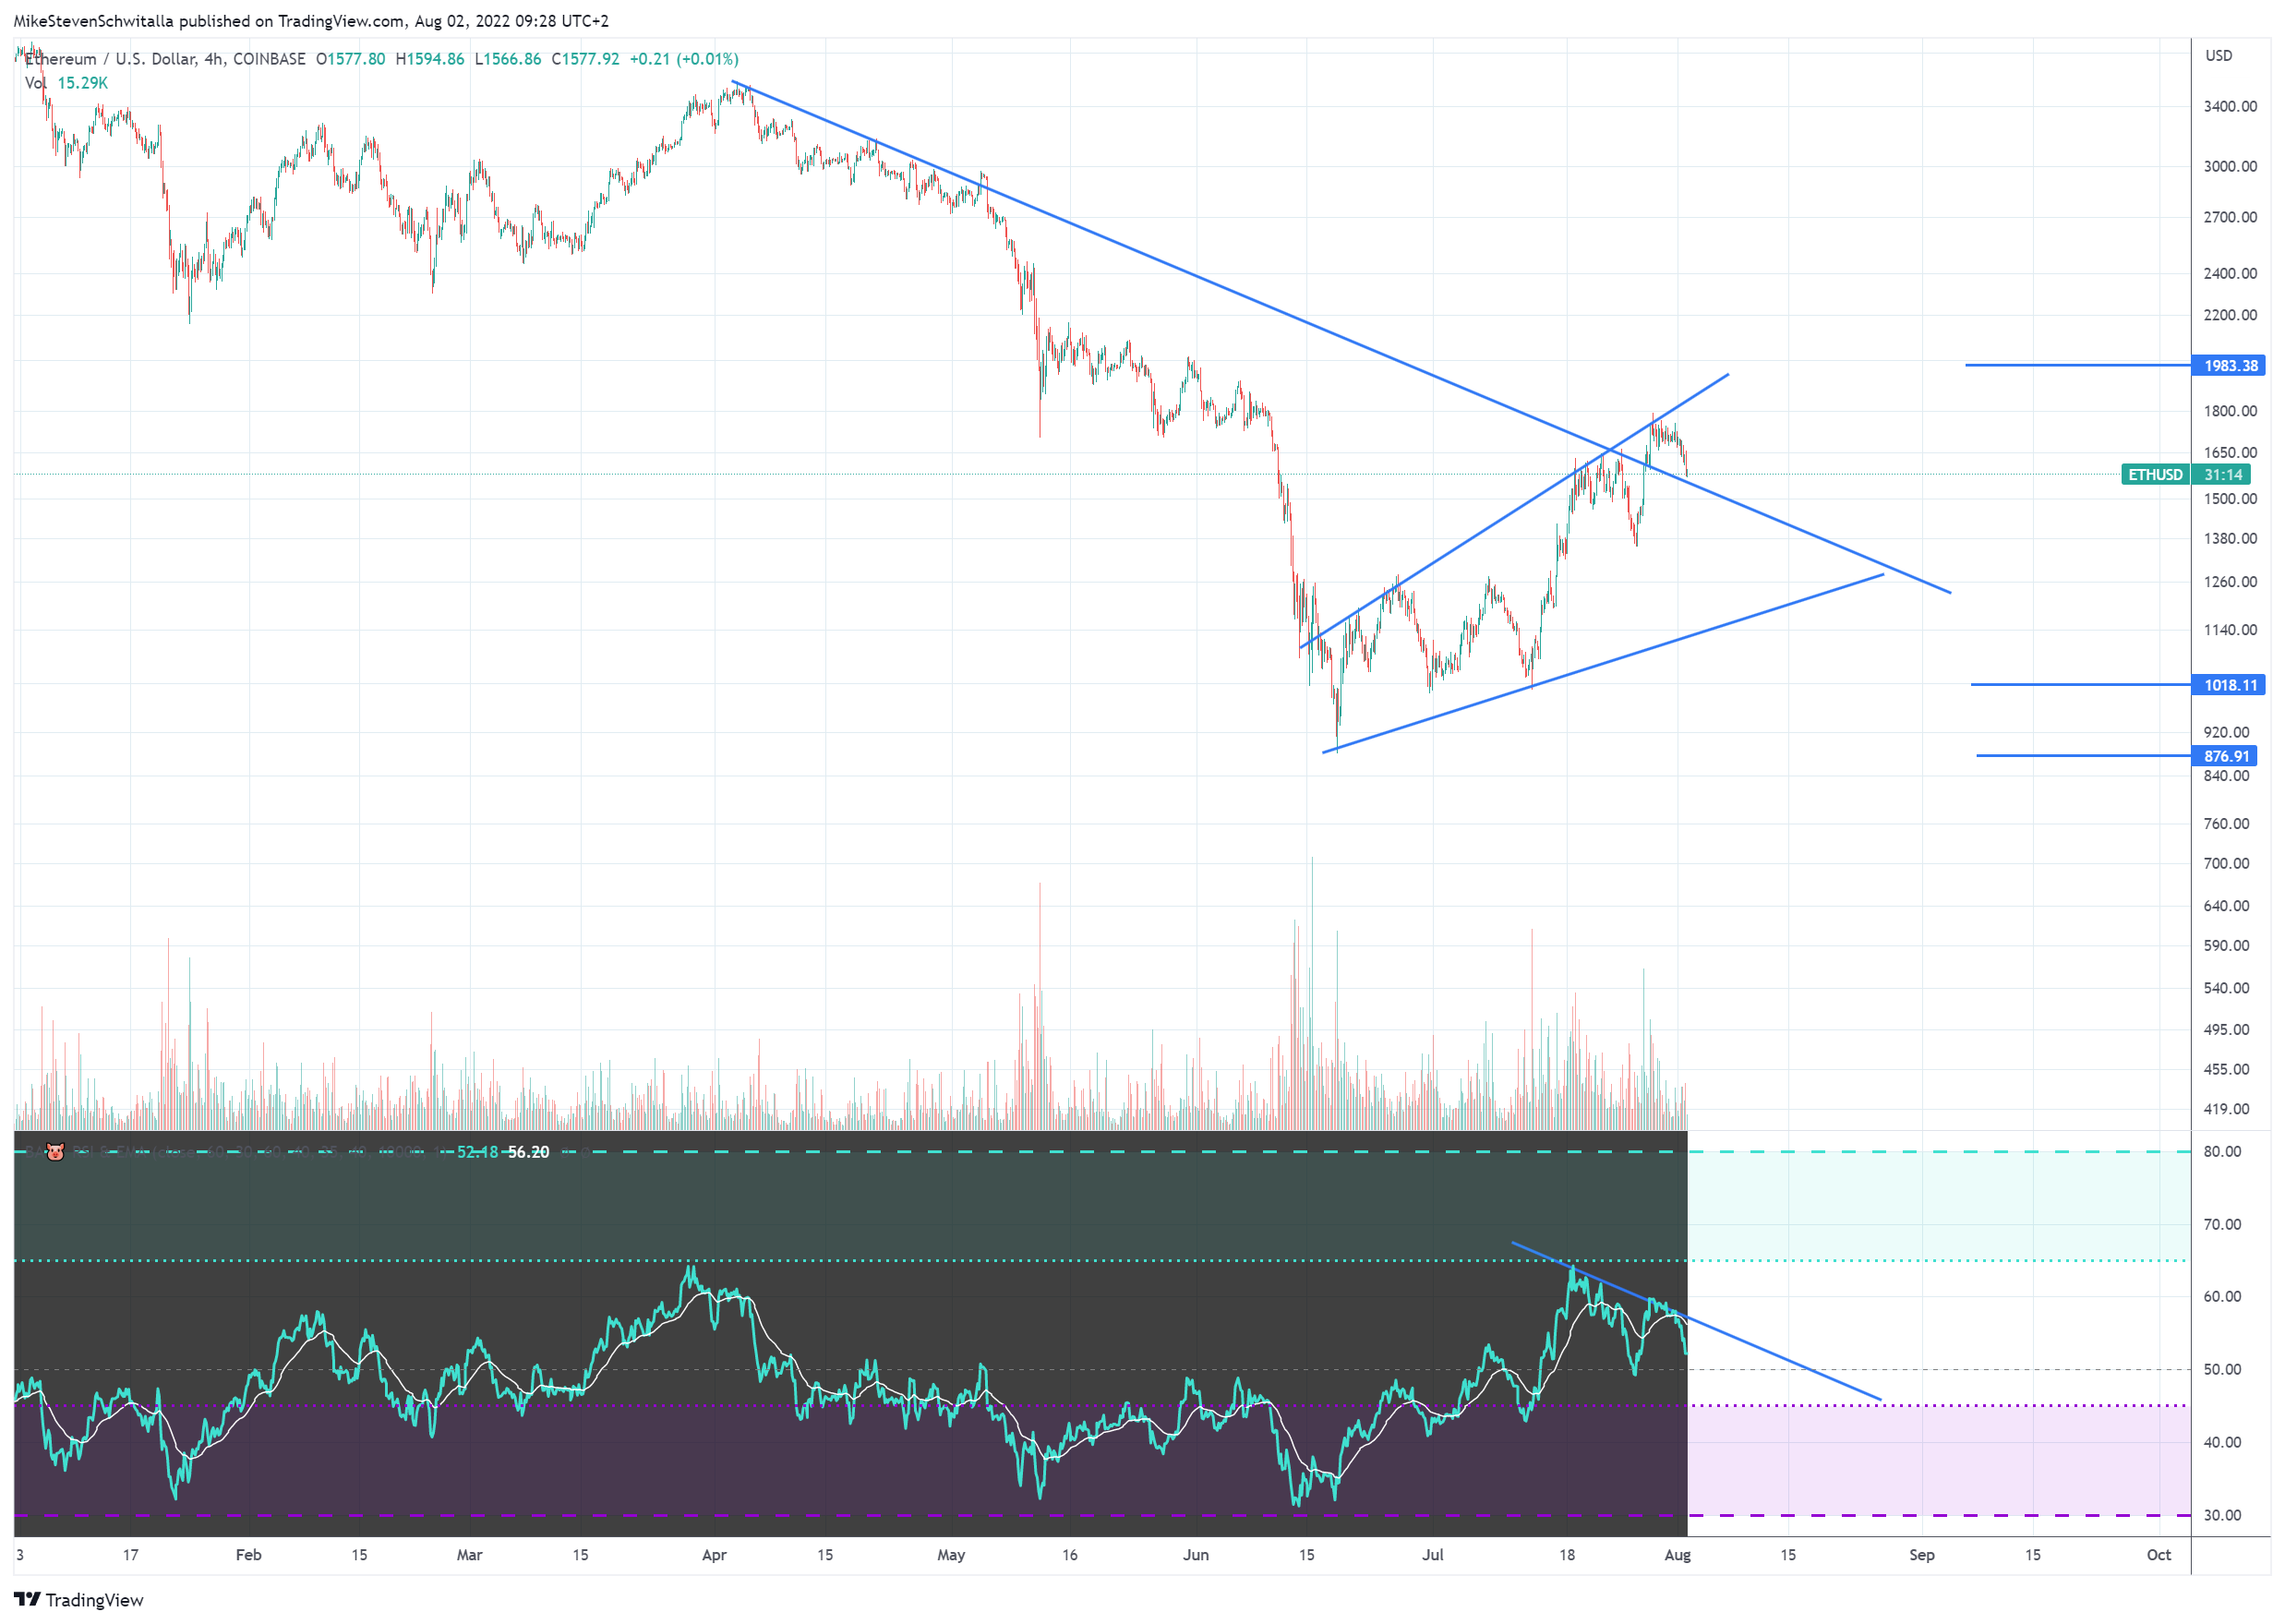
ETH$ 4h
In ETH$, the divergence in the RSI is strong. Therefore, I expect a setback to USD 1,380 or even lower to USD 1,000.
Supports: USD 1,380, USD 1,000, USD 875
Resistances: USD 1,985
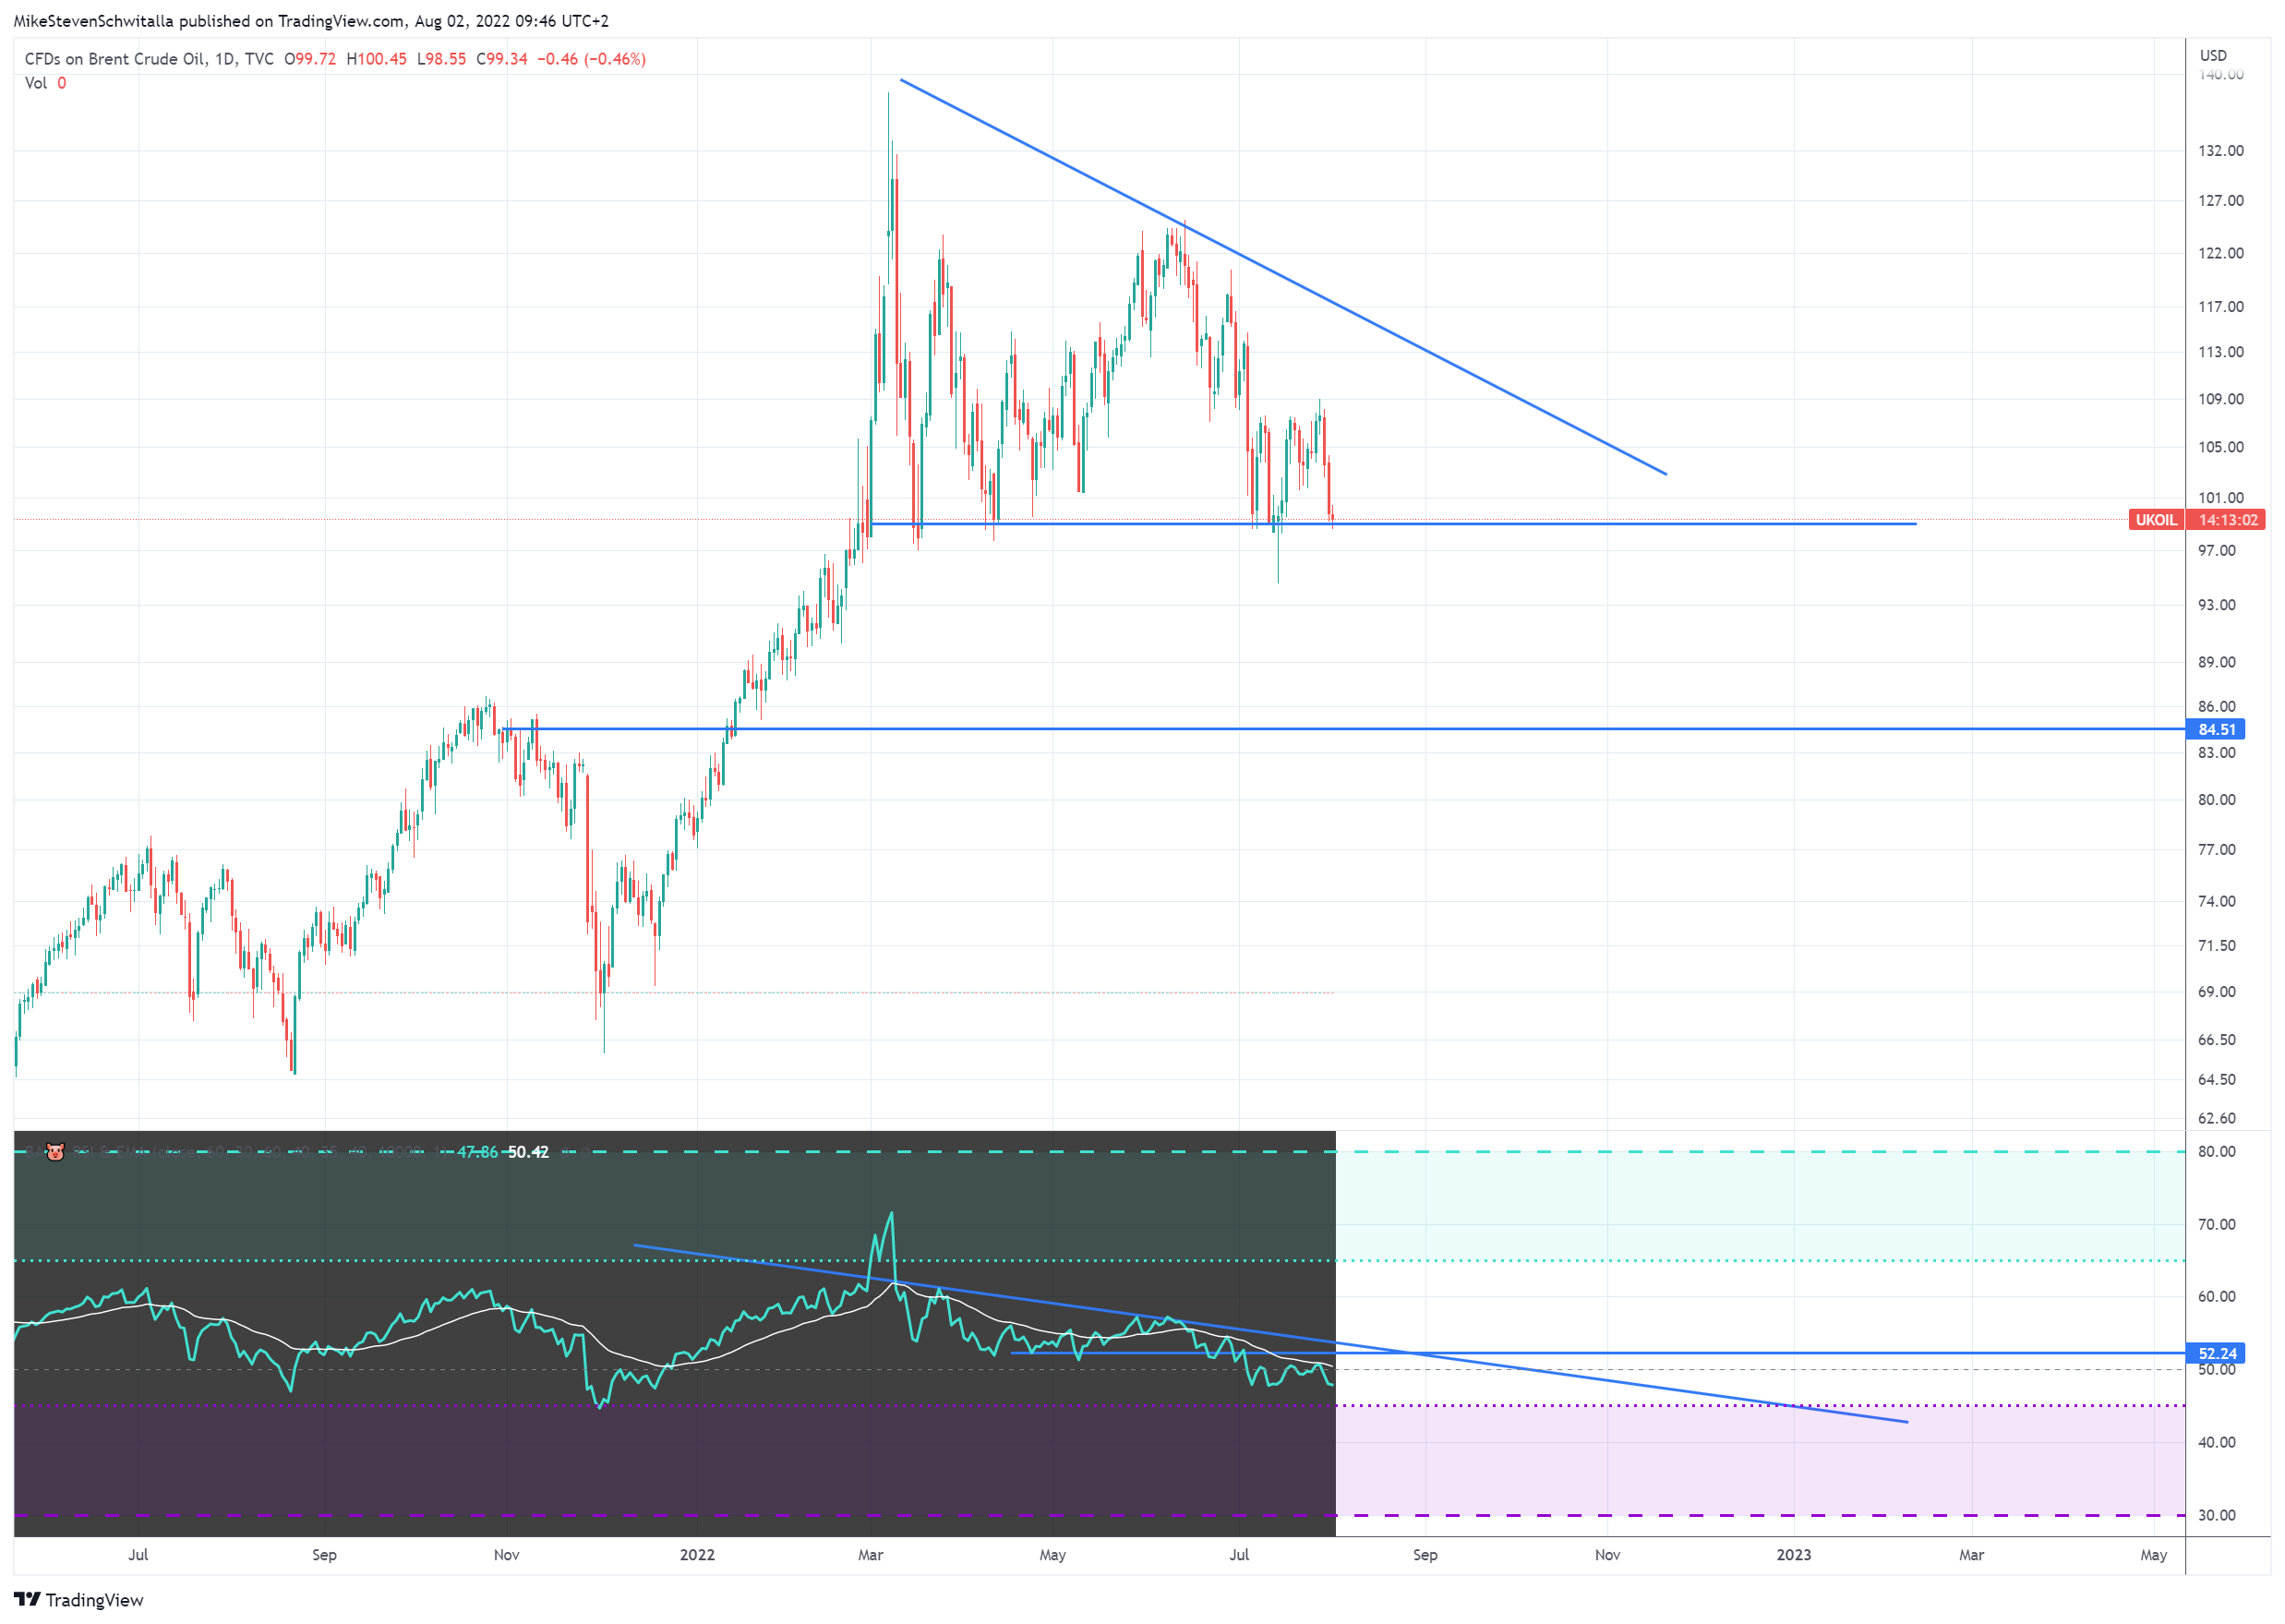
Brent Crude Oil 1d
Oil also looks vulnerable, and could soon break through the support at USD 100 to the lower side. This is also indicated by the RSI, which is already significantly lower. In the medium-term, I see oil 15% lower at USD 85.
Supports: USD 100, USD 85
Resistances: downtrend, USD 120, USD 140