Yet
again, the week has been slow and driven by macro headlines. Cryptocurrencies
keep holding up better than TradFi with volatility decreasing, while VIX
breached 32, MOVE is above 148 and DXY is at 113. Looking ahead, we will soon
have the FOMC minutes and CPI numbers.
On the
macro side:
Last week, both unemployment numbers and NFP came in.
NFP were +263k in September, above the expected 250k, but below the previous
315k. The
unemployment rate dropped from 3.7% to 3.5%, but the participation rate dropped
by 0.1%. As we mentioned in the past, if the labour market holds steady the Fed
will keep pursuing the goal “to foster economic conditions that achieve both
stable prices and maximum sustainable employment”. In other words: it will keep
hiking until something breaks – regardless of whether this is on the demand
side or the supply side.
I am not
expecting a Fed pivot any time soon, and we are very likely to see another 2x
75bps on both Nov 2nd and Dec 14th meetings, going into 425-450bps target rate
by year end.
Financial
markets, and especially the FX and FI markets are very stressed, but equities
are surprisingly (?) holding up well.
1. ICE
BofA CCC & Lower US High Yield Index Option-Adjusted Spread rose to 12.32%
from 7.34% on January 2022, yet on March 2020 it was 17.79% and on March 2008
it was 36.7% (source: https://fred.stlouisfed.org/series/BAMLH0A3HYC# )
(chart 1:
CCC Spread)
2. ICE
BofA BB US High Yield Index Option-Adjusted Spread is still rather low ~3.21%,
but considering the uptrend and the debt structure of BB economies it is a
“quiet value” (source: https://fred.stlouisfed.org/series/BAMLH0A1HYBB )
(chart 2:
BB spread)
3. VIX is
at 32.45 and MOVE at 148.45 with the VVIX at 107.11 (both equities and bonds)
Derivatives
players are looking for both downside speculation and hedging. Nevertheless,
these indices move quickly and even if it is hard to time them, they report the
market fear.
(chart 3:
VIX and MOVE https://s3.tradingview.com/snapshots/n/NZ69XSzN.png)
4. US
mortgage rates keep rising:
a. 30-year Fixed 6.66% vs 3.098% on Jan 22
b. 15-year Fixed: 5.9% vs 2.43% on Jan22
c. 5/1 ARM: 5.36% vs 2.41 on Jan22
It makes
a huge difference to ask for loan to buy a house at 5.9% instead of 2.43%. In
dollar terms, a 15-year loan on $500k in January 2022 is equivalent to a loan
on 361k today. That’s a 27.8% decrease in purchasing power (excluding
inflation)! We might expect these discrepancies to weigh on house prices very
soon.
(chart 4:
US mortgage rates )
It is
hard to say if things are going to get worse or better from here, but I would
rather expect that many sectors will suffer more than others. The cascade effect
is hard to pre-test. But there is more pain out there.
TradFi
Equity indices are approaching pre-Covid levels:
1. SPX:
$3,612 vs. $3,385 before covid
2. NDQ: $10,926 vs. $9,718 before Covid
3. DJI: $29,202 vs. $29,537 before Covid
These
levels act as a magnet and breaking through them might dictate the next market
moves, also in the digital space.
Looking
ahead:
This week is once again all about the Fed:
1. Wednesday 8 pm CEST: FOMC Minutes Release
2. Thursday 2.30 pm CEST: CPI Release
Markets
are positioned as follows, and I am not expecting any sharp moves, unless
numbers are way worse or much better than the expected.
a. US CPI MoM: cons: 0.2%, prev: 0.1%
b. US CPI YoY: cons: 8.1%, prev: 8.3%
c. US Core CPI MoM: cons: 0.5%, prev: 0.6%
d. US Core CPI YoY: cons: 6.5%, prev: 6.3%
On the
crypto side:
Most digital assets are holding prices in tight ranges:
– $BTC: $19,051 (-3% WoW) and 30-day Realized Vol: 52.67% (bottom 15% last
360d)
– $ETH: $1,276 (-3.56% WoW) and 30-day Realized Vol: 76.15% (bottom 30% last
360d)
– $SOL: $31.44 (-4.41% WoW) and 30-day Realized Vol: 78.77% (bottom 5% last
360d)
Despite
being very volatile assets, volatility in general decreased as liquidity shrunk
and May fears seem to have passed (Terra-Luna, 3AC, Celsius, Voyager, etc.)
Also,
recently options market makers have been long gamma, and to hold delta-neutral
positions they were selling spot (and/or the future) on any uptick and buying
spot (and/or the future) on any downtick, thus compressing the volatility and
pushing down both the futures basis and the funding rates.
As a
reference, these have been the funding rates on FTX:
a. BTC 7d avg: -3.56% vs. 90d avg -2.28%
b. ETH 7d avg: -7.6% vs. 90d avg -11.72%
c. SOL 7d avg: -5.12% vs. 90d avg -7.39%
Currently,
BTC gamma exposure is approaching lower levels. While premia between the
implied volatility and realized volatility are tiny, as soon as the GEX
approaches zero or even negative territory, we may expect a pick-up in
volatility.
(Chart:
BTC GEX and ATM Implied Volatility)
Looking
at the spot chart:
BTCUSD is holding the XABCD pattern and if it approaches $17,500 (support), the
double bottom would then be tested. RSI is neutral and $20k is once again the
resistance.
https://s3.tradingview.com/snapshots/7/7enCty3o.png
Crypto maintained tight ranges last week as the macro outlook worsened, with BTC and Alts outperforming TradFi risk assets
Once again, the past week was slow, with tight liquidity. Looking ahead to this week, US non-farm payrolls data will be released (cons: 250k, prev: 315k), which will serve to help assess how Fed Policies are impacting the real market, and whether the Fed will slow down with its “Quantitative Tightening” programme.
Some macro events that I am following closely are the following:
- EU banking concerns (CS and DB)
- UK bond market and political actions
- Military developments in Ukraine
Liquidity scarcity is in my opinion one of the major issues that central banks are currently facing.
Indeed, the Fed balance has shrunk just a little. Looking at the Overnight Reverse Repurchase Facility (ON RRP), the billions of dollars that are literally parked there and getting 3.05% has skyrocketed.
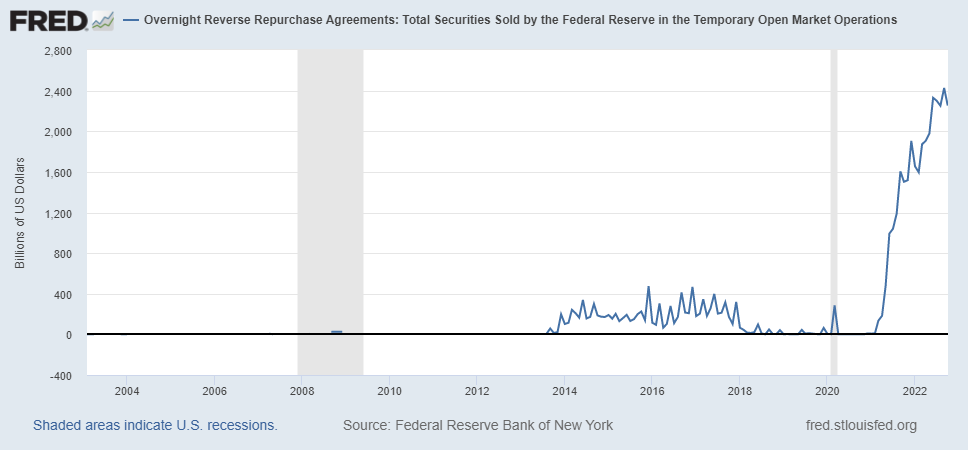
Investors have $4.6 trillion stashed in US money market mutual funds, while ultra-short bond funds currently hold about $150 billion. And the pile is growing. Cash saw inflows of $30 billion in the week through Sept. 21st, according to figures from EPFR Global.
Investors have really few reasons to deploy capital into risky assets, even considering the high inflation.
Also, according to Fed data there are ANOTHER $18 trillion in deposits at US commercial banks, and US banks are sitting on more than $6 trillion of surplus liquidity, meaning that they do not know what to do with this cash as investing and loans do not look appealing. In 2008, with a completely different economy, surplus liquidity was $250 billion, some cash had been printed there…
Nevertheless, the spread between what banks are paying on deposits and what money market funds are offering is becoming wider and wider and is pushing the usage of RRP facilities even higher.
I somehow believe that a reduction in RRP counterparty caps could possibly be the most efficient method of encouraging a cash movement. As we move into a new state of the economy, with non-conventional monetary policies becoming conventional and public debt simply increasing, we might have both elevated RRP balances and reserve scarcity going forward.
Will things break at some point?
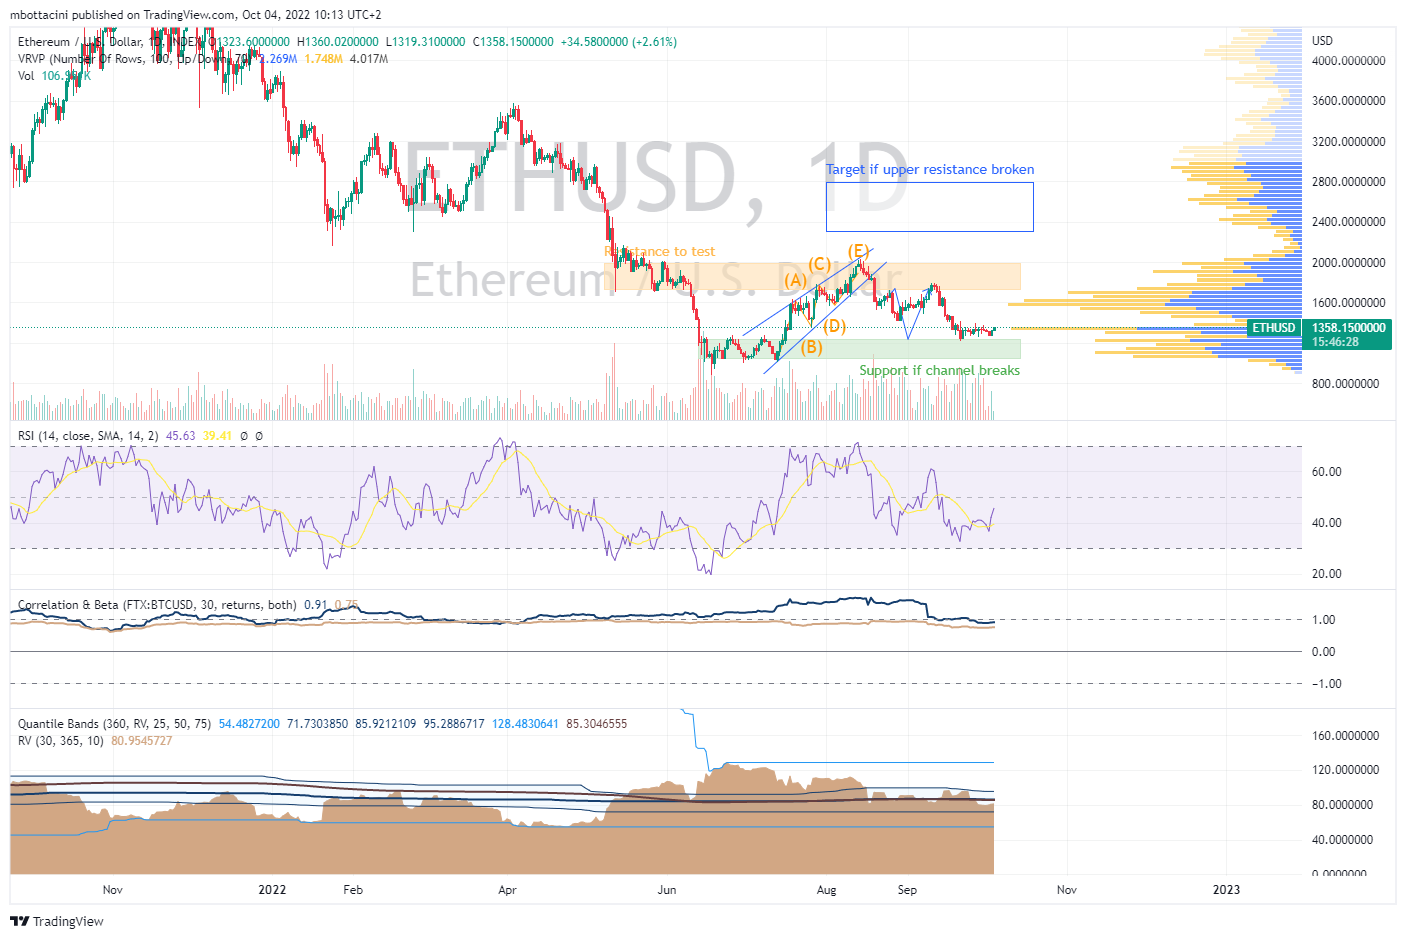
Looking at ETHUSD, we are now just above the $1,200 support. 30-day Realised Volatility is trading at 80%, and the 30-day ATM Implied Volatility is trading at 82%. As we are now trading around the median of the one-year historical volatility, a lower volatility is reasonable (i.e. around 70%).
Looking at the ETH Gamma Bands, we are now in the upper 1/2G, thus a short-term reversal is expected.
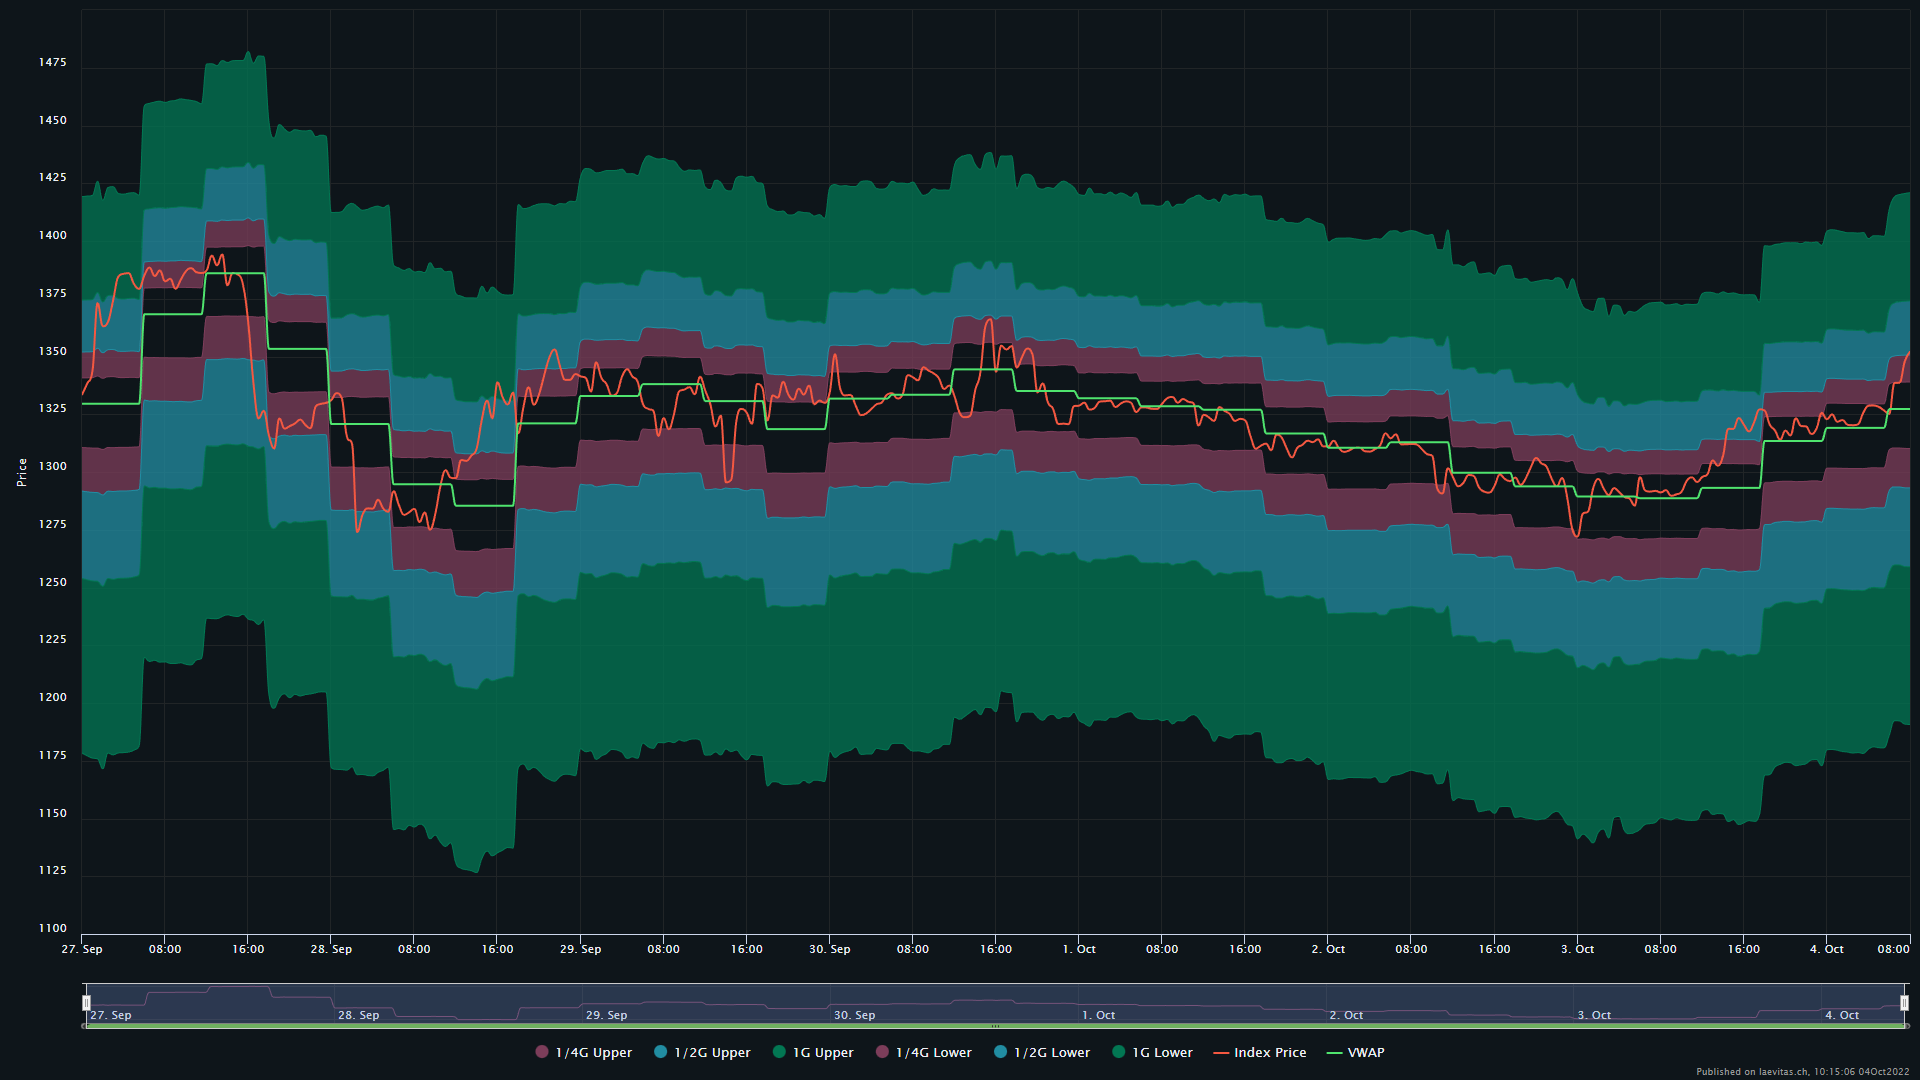
Nevertheless, support is $1200 and resistance at $1750